Bitcoin's Historical Price Trends and Current Market Dynamics
Explore Bitcoin's price evolution, current market analysis, expert insights, and key Ethereum metrics shaping the cryptocurrency landscape.
Bitcoin (BTC), the pioneering cryptocurrency, has experienced a remarkable journey since its inception in 2009. From its early days of negligible value to surpassing the $100,000 mark in 2024, Bitcoin's price history reflects its evolution and the growing acceptance of digital assets in the global financial landscape.
Historical Price Milestones
-
2010: The first recorded Bitcoin transaction involved 10,000 BTC exchanged for two pizzas, highlighting its initial novelty.
-
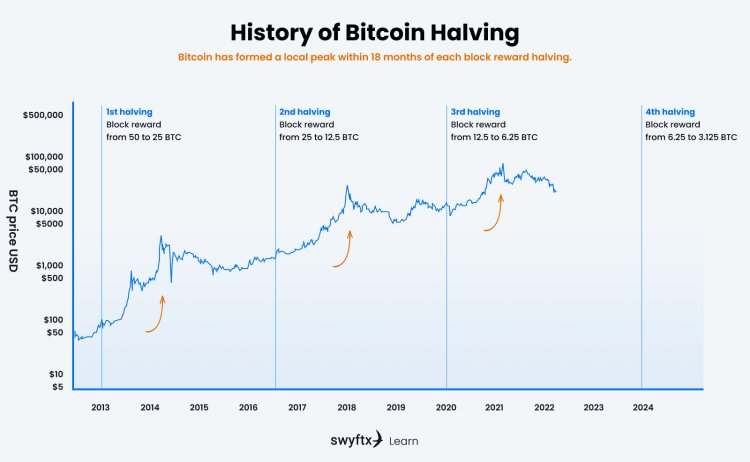
2013: Bitcoin's price reached $1,000, marking its emergence as a notable financial asset.
-
2017: The cryptocurrency experienced a significant surge, peaking near $20,000 before undergoing a substantial correction.
-
2020-2021: Amidst global economic uncertainties, Bitcoin saw accelerated adoption, driving its price beyond $60,000.
-
2024: Bitcoin achieved a historic milestone, surpassing $100,000, underscoring its resilience and growing institutional interest.
Current Market Analysis
As of February 23, 2025, Bitcoin is trading at $96,210.00, reflecting a slight decrease of 0.00339% from the previous close. The intraday high stands at $96,900.00, with a low of $96,136.00. This stability suggests a consolidation phase following the significant gains of the previous year.
Ethereum (ETH), the second-largest cryptocurrency by market capitalization, is currently priced at $2,781.41, showing an increase of 0.03302% from the previous close. The intraday high is $2,792.69, and the low is $2,679.35. Analysts predict potential growth for Ethereum, with projections estimating a rise to $4,000, contingent upon maintaining support levels around $2,300.
Market analysts highlight the influence of social sentiment on Bitcoin's price movements. Positive sentiment can create a feedback loop, driving prices higher, while negative sentiment may lead to downturns. Understanding these dynamics is crucial for investors navigating the volatile crypto markets.
Additionally, on-chain metrics for Ethereum suggest that the asset may be undervalued. Indicators such as the Network Value to Transactions (NVT) ratio, which compares market capitalization to transaction volume, provide insights into Ethereum's valuation and potential for future growth.
-
Network Value to Transactions (NVT) Ratio: This metric, akin to the price-to-earnings ratio in traditional finance, is calculated by dividing Ethereum's market cap by the volume of ETH transmitted through the network. A lower NVT ratio may indicate undervaluation, while a higher ratio could suggest overvaluation.
-
Total Value Locked (TVL): Representing the total capital held within Ethereum-based decentralized finance (DeFi) protocols, TVL serves as a barometer for the network's utility and adoption. Fluctuations in TVL can reflect changes in user engagement and confidence in DeFi applications.
-
Gas Fees: The cost associated with executing transactions on the Ethereum network, known as gas fees, can influence user activity. Elevated fees might deter participation, whereas lower fees could encourage more transactions and smart contract deployments.
Final Thought
Historical patterns and upcoming events, such as Bitcoin's halving cycles and potential regulatory developments, may influence future price trajectories. Some projections suggest that Bitcoin could reach $150,000 by 2025, assuming historical trends persist.
For Ethereum, the increasing adoption of decentralized applications (dApps) and improvements in network scalability are poised to enhance its value proposition. However, investors should remain cognizant of market volatility and conduct thorough research before making investment decisions.
What's Your Reaction?